
How accurately does The Weather Channel app predict rainfall in Phoenix?
- Jul 22, 2023
- 6 min read
Updated: Jul 23, 2024
On occasion, various members of my family have expressed doubt about The Weather Channel app’s ability to accurately predict Phoenix’s rainfall.
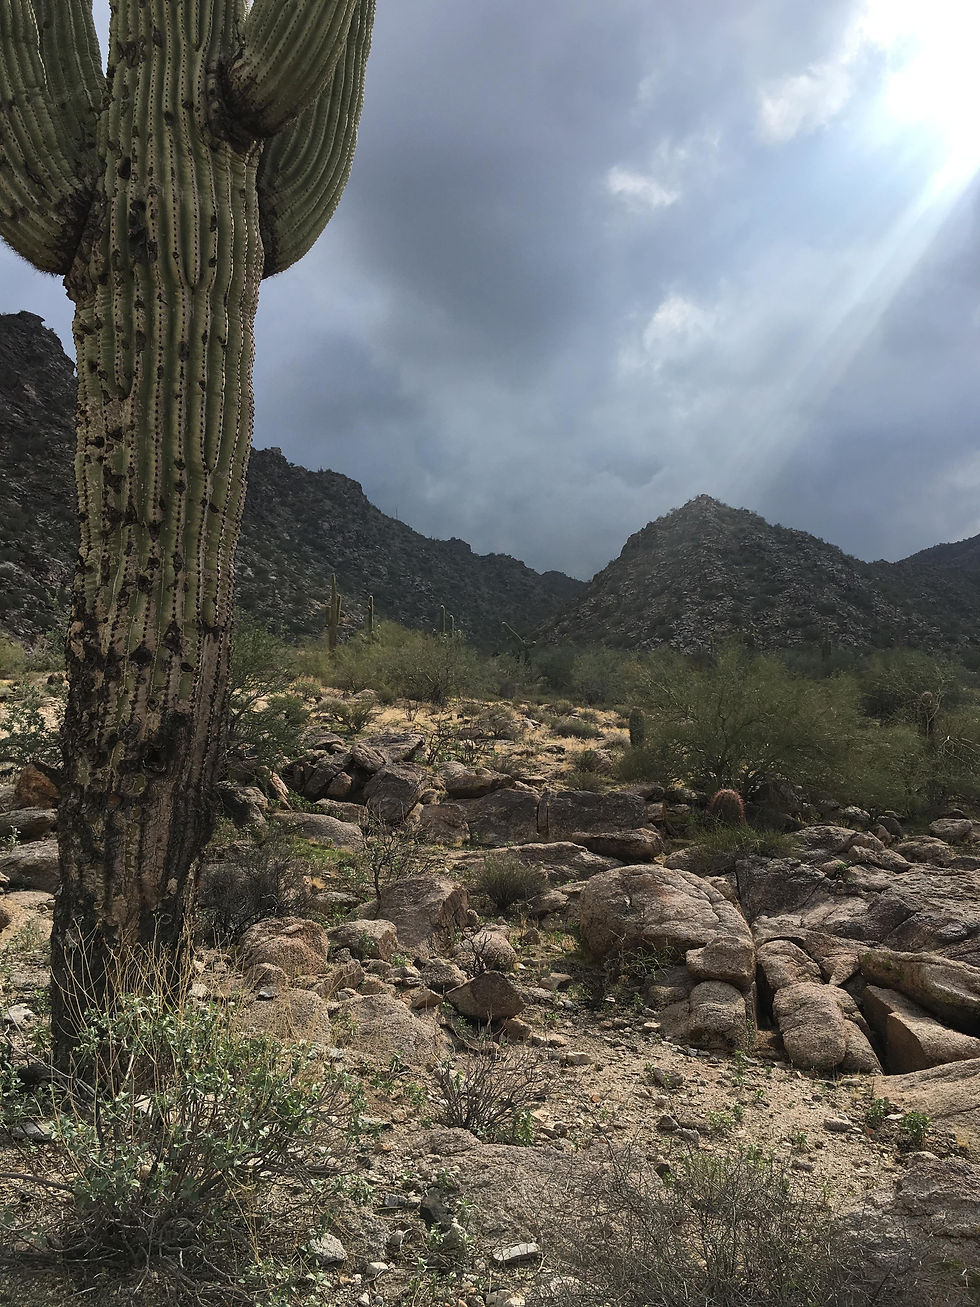
This doubt shifted to outright suspicion when some friends from Minnesota came to visit and we went hiking on South Mountain. Dark clouds rolled in and we were surrounded by rainfall. But through it all – and even with respectable cellular reception – my app said we had a 0% chance of rain.
Everything worked out fine and the incident made for a funny story. But for one member of my family, this was too much. He wanted to know if the app really could be depended upon as a source of precipitation prediction.
Thankfully, we have ways to determine that, I said. Before we jumped into data collection, though, we had to determine what exactly it was we wanted to know. In other words, our research question. We settled on, “Does a higher percent chance of rain predicted for Phoenix on The Weather Channel app result in rainfall in my backyard more frequently than lower percent chances of rainfall?”

Each morning, shortly after he awoke, my “junior assistant” opened The Weather Channel app on my phone and recorded the app’s predicted percent chance of rainfall for that day and the next 13 days on a spreadsheet. He then checked a rain gauge in our backyard to see how much rainfall we had received over the last 24 hours.
With the exception of six days, he recorded rainfall daily from August 17, 2021, to January 10, 2022, a total of 140 days.
I ran a regression to examine the relationship between received rainfall and predicted chance of precipitation. In statistics, a regression is used to examine whether something can predict something else. In other words, how much the presence or absence of something (in this case, rainfall) depends on the presence or absence of something else (predicted chance of rainfall). In regression analysis, a person can determine an equation that describes how, on average, the dependent variable is related to the independent variable.
The results of the regression were statistically significant. Predicted percent chance of rain predicted rainfall.
In the total sample, predicted percent chance of rain ranged from 0% to 80%. However, a 0% chance of rain accounted for 40% of the entire sample. A 10% chance of rain or less comprised about 70% of the sample. In fact, a 50% chance of rain or higher happened rarely, in less than 5% of the entire sample.
In other words, this regression was statistically significant because we were often told we had little to no chance of rain, and most of the time, we, in fact, received no rain.
But that wasn’t really what we wanted to know. We were interested only in the days we had rain, and what the percent chance of rain tended to be on those days.
Isolating the days we had rain and running statistical tests on them posed a problem. Out of the 140 observed days, only 13 of them had rainfall. And our definition of “rainfall” was more desperate than the National Weather Service’s definition, which is at least .01 inch (about .03 cm).
Sample size refers to the number of observations or participants in a study. In this instance, our sample is the number of recorded days. In statistics, sample size can influence the precision of our estimates and our ability to draw conclusions. Having a small sample size can result in an increased likelihood of inconclusive or contradictory results, especially if there is a lot of variation within a sample.
Yet, studies with low sample sizes are rampant. David G. Jenkins and Pedro F. Quintana-Ascencio argued in their 2020 study that insufficient sample size has been used in about half of medical and epidemiological meta-analyses and meta-regressions, about two-thirds of ecological disturbance studies, and about four-fifths studies of species-area relationships in biogeography. “This fundamental problem contributes to uncertainty in subjects as disparate as benefits of exercise, linkage between binge drinking and heart disease, ecological disturbances, and the relationship between natural diversity and habitat area,” they said.
For as important as sample size is, there isn’t a hard-and-fast rule on what a minimum sample size should be. Some academic journals require a minimum sample size, and depending upon the discipline and research design, journal reviewers may suggest minimums of anywhere between 10 to 50 per predictor variable.
That may not seem like a big deal. But if you’re studying data that are difficult to acquire or are aggregated, 10 to 50 observations could be unreasonable, unthinkable, or even unethical. Depending upon what you’ve set out to collect and the reasons behind it, the practical implications of identifying 50 cases of something can be disastrous. If someone is trying to acquire resources to abate a specific problem, for example, and they cannot get said resources until they produce convincing statistical results, by the time they have an ample sample size to produce said convincing statistical results, the problem they were initially trying to abate may have become painfully irrelevant compared to the compounded problems they now have as a result of not abating that specific problem earlier.
There are other methods and philosophies surrounding data collection, some more familiar and accepted than others, for a variety of reasons. I could devote multiple blog posts to such debates, and still fall short of explicating their strengths and weaknesses. For the purpose of my specific research question and data set, I followed Jenkins and Quintana-Ascencio’s (2020) analysis, in which they cautiously recommended a sample size of at least 25 for regressions.
But, like I said earlier, I only had 13. It doesn’t rain much in Phoenix. So my junior assistant returned to data collection.
This second batch included July 21, 2022, to September 25, 2022, which was during Phoenix’s monsoon season. Monsoons are, according to the National Weather Service, “large-scale wind shifts that transport moist tropical air to dry desert locations.” It’s a time when we expect thunderstorms, which generally differs from other seasons. This difference between our two batches is not ideal. However, we needed rainy days to observe, and my junior assistant was growing restless.
With this new sample, we had 207 observed days, with 28 of them including rainfall. Overall, there were statistically significant differences between the average percent chance of rain predicted for days we received rain and days we did not. On days we received rain, the predicted percent chance of rain for that day, as of what the app said that morning, averaged 26.54%. But on days we did not receive rain, the predicted percent chance of rain for that day averaged 7.48%. These differences in means were statistically significant up to 10 days.
However, there were outliers. Though the percent chance of rain for days it rained ranged from 0% to 80%, this range was 0% to 75% on days it did not rain. The morning we received the most amount of rain in this sample (1.25 inches or 3.175 cm), the percent chance of rain as of that morning was 23%. Whereas the mornings we had the second- and third-highest percent chance of rain out of the entire sample (76% and 72%, respectively), we received no rain. Based on information posted by the National Weather Service, percent chance of rain “is simply a statistical probability of 0.01" inch or more of precipitation at a given area in the given forecast area in the time period specified.” It’s a likelihood of an occurrence. Likely things sometimes don’t happen. And unlikely things sometimes do happen.
So, overall and over an extended period of time, yes, the percent chance of rain predicted for days we actually receive rain in Phoenix will be higher than days we don’t receive rain. But on a case-by-case basis, I still recommend being prepared for the unlikely. A 72% chance of rain may fill my sun-scorched neighbors with optimism, but it can still lead to disappointment. And a 0% chance of rain can, in fact, still put you and some Minnesotans dead center in a downpour on South Mountain.
However, considering we are once again in monsoon season but haven’t had measurable rain since March 22, I doubt a whole lot of people would be unwelcoming toward a surprise shower.
Even my junior assistant.